
31 Oct World carbon footprints COP26
The amount of carbon dioxide that you, as a consequence of your lifestyle or your organisation release into the atmosphere, by you going about your normal daily routines, is called your CARBON FOOTPRINT. It is usually measured in kg of carbon dioxide, although when measuring a country’s carbon footprint that will be in tonnes. 1 tonne = 1000kg.
Country Carbon Footprints
Let us have a look at what is happening in the world with carbon emissions. The main contributor to the carbon emissions of a whole country focuses around how that country generates electricity. If a country burns fossil fuels, i.e gas, coal or oil to make electricity then they will have a high value for carbon emissions. The data are worked out by taking the amount of carbon given out and dividing it by the population to give a value per capita. This is needed to give a fair comparison.
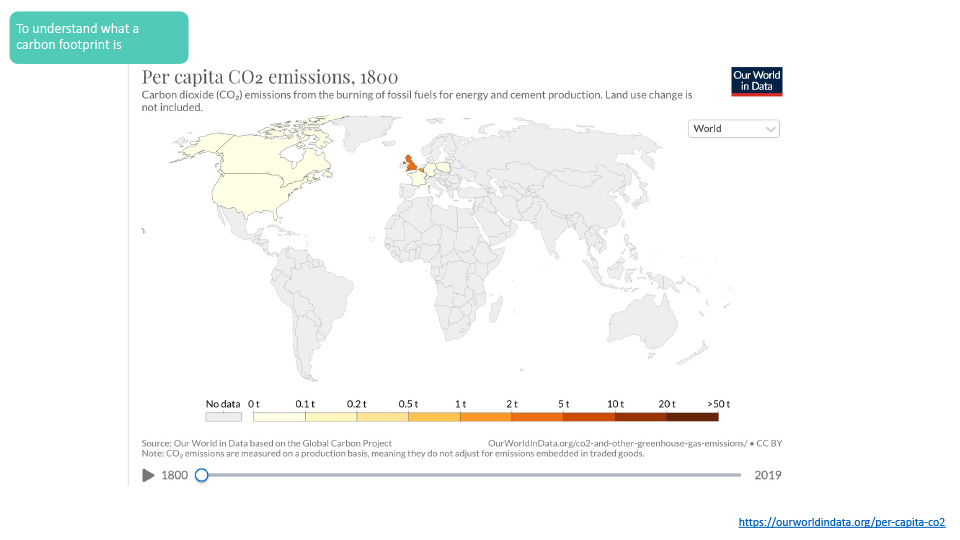
We start in 1800.
This is the start of what historians call the Industrial Revolution and it all started in the UK. Millions of people who were working in agriculture found themselves in factories and the economy was booming- all built on coal. Pollution, and greenhouses gases and fossil fuels helped to build Britain’s prosperity during the 19th century.
If you want to use the link:
https://ourworldindata.org/per-capita-co2
you can travel through time, looking at the situation in 1915 which was the Great or First World War. In 1940 you will see the effect of the Second World War. Moving though time, you will pass the swinging sixties, and eventually entering a new century.
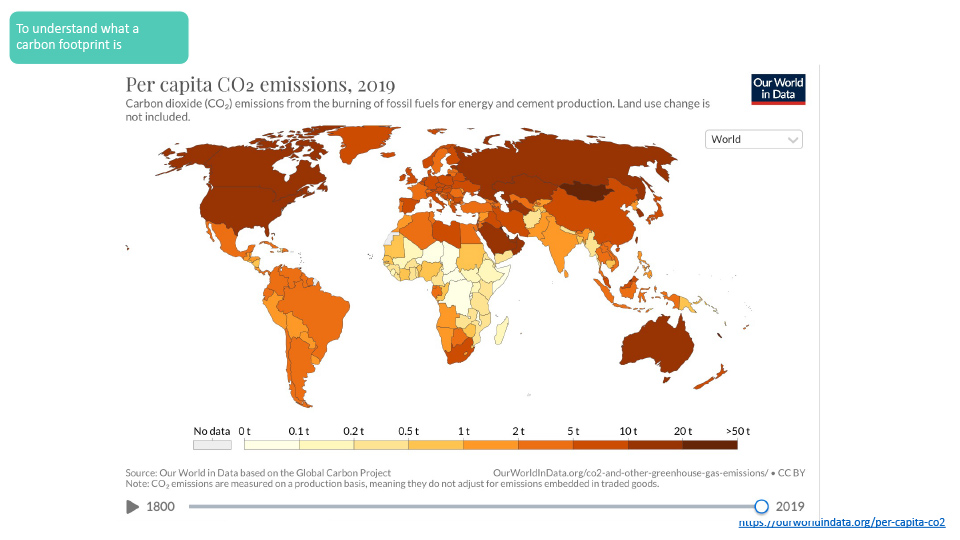
We have arrived at 2019 – who are the big carbon emitters today?
Which countries can effectively stop global warming by decarbonising their energy?
Which countries are well on track to reduce emissions?
In 2019, the average global carbon dioxide emission per capita was 4.72 tonnes.
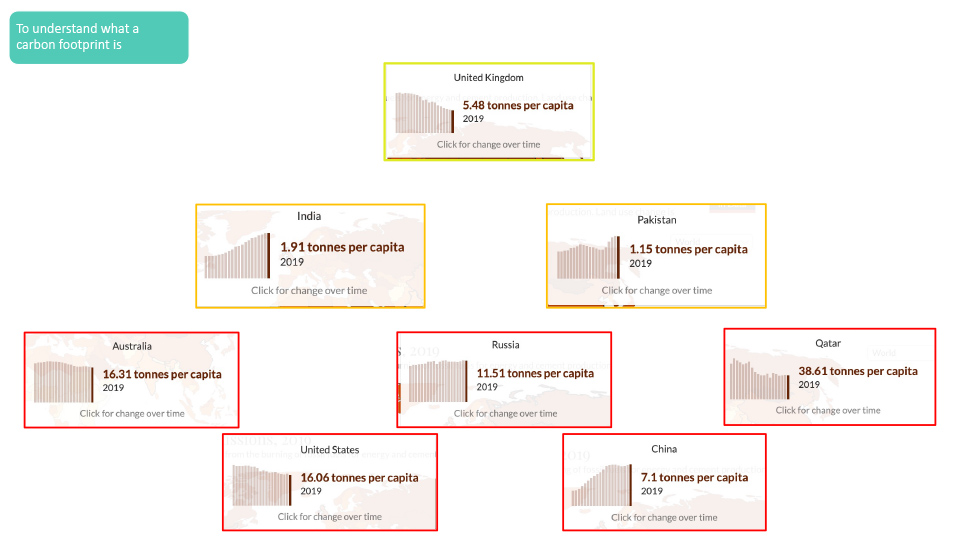
Let’s start with the UK. The UK is one of the world leaders in decarbonising their economy – having started it all 120 years ago, it is just as well. They are aiming to become net zero by 2050. Coal power stations have all but disappeared and no new gas power stations are being built. Huge resources are being channelled into wind and solar power. The government have recently announced that they want private homes to install heat pumps for their energy needs. We will tentatively give it a yellowy green border, changing to solid green once it has delivered.
Other countries in Europe worth a mention:
France is a low carbon emitter (4.97%) in Europe as 96% of their power comes from nuclear.
Sweden is another noticeable lighter orange (4.26%) as much of their electricity generation comes from hydropower and nuclear.
Portugal, another light orange (4.75%), is investing in renewable electricity generation and is aiming for an 80% renewable supply in the future.
As less developed economies gain prosperity, their emissions will start to rise if this is connected to fossil fuel use. A good example of this is Pakistan and India.
They are, at the moment, low carbon emitters but look carefully at the trend. As these countries gain prosperity, this is being built on the use of fossil fuels, so the trend for carbon emissions is going up – the wrong direction to alleviate climate change.
And now for the not so good….
Russia is using and delivering gas to most of Europe. They own huge gas reserves and have built pipelines which deliver it to countries right across the Continent.
Australia is sitting a bed of coal which is fuelling their economy. The prime minster of Australia had to be persuaded to come to COP26. To wean the economy off its coal addiction will not be easy but at some point their government will need to bite the bullet and do something about it.
America (US) has its own gas and oil and just guzzles fossil fuels to make its economy successful. The US has a big population, and these data are emissions divided by the population so the actual amount of carbon emitted is huge.
China is another country to join the red borders. This value which is per capita looks quite low but China has a huge population so when you divide by that number to get a world comparison it reduces the tonnage value. In reality, the absolute amount of carbon emissions is huge because China is also sitting on a bed of coal that is fuelling its economy.
Qatar supplies the whole planet with petroleum and so as its economy depends on oil and with a relatively small population, it takes the top spot as the world’s biggest carbon emitter per capita in 2019.
If all countries radically decarbonise their economies, especially the “red borders” we would not have a looming climate disaster.
Sorry, the comment form is closed at this time.